E-bikes are now one of the fastest-growing forms of transportation worldwide. Global sales are expected to reach over 80 million units by 2030, and the market is already valued at $32 billion in 2025.
Whether you’re comparing e-bikes to cars, tracking adoption trends, or exploring safety and tech upgrades, these 81 e-bike statistics give you a complete, up-to-date view of the industry.
From real-world usage data to environmental benefits and market forecasts, this report covers the most important numbers shaping e-bike growth in 2025.
Key Summary: E-Bike Statistics You Should Know in 2025
- The global e-bike market is worth $32 billion in 2025 and is expected to reach $120 billion by 2030.
- Over 130 million e-bikes were sold worldwide between 2020 and 2023.
- U.S. e-bike sales rose 240% from 2019 to 2021 and are expected to hit 6.4 million units per year by 2025.
- E-bikes emit just 4.9 grams of CO₂ per mile, compared to 274 grams for gas cars.
- 96.4% of riders say they enjoy e-bikes more than regular bikes, and 75% would rather ride than drive.
How Big Is the E-Bike Market in 2025?
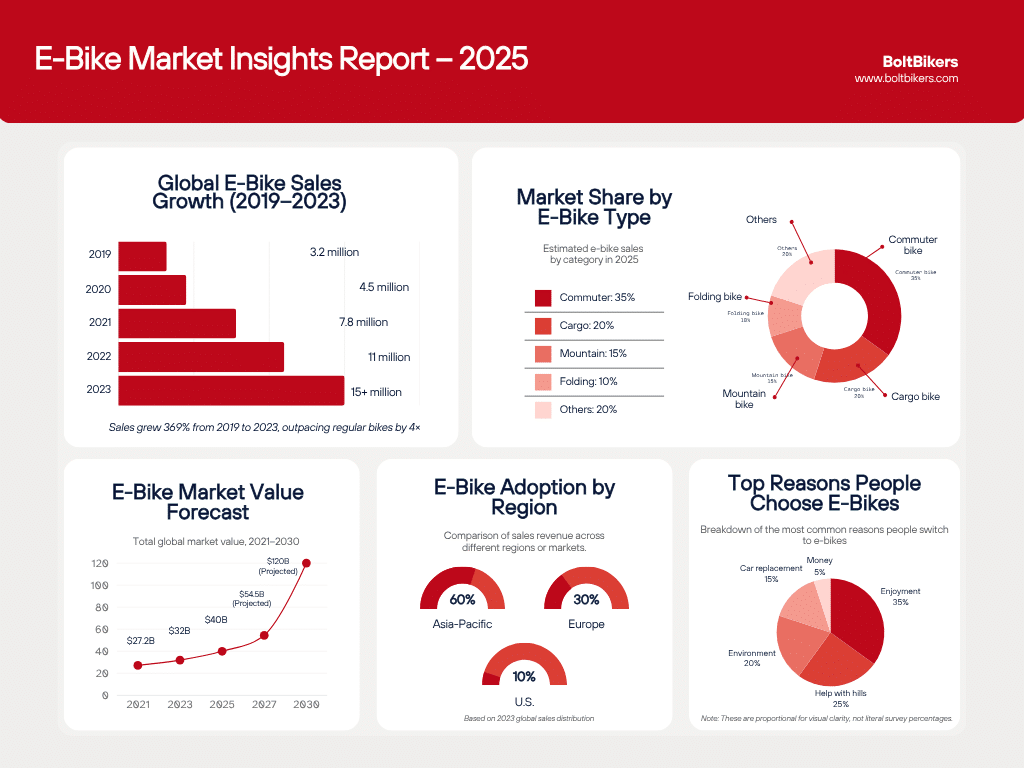
The global e-bike market is worth $32 billion in 2025 and is projected to nearly quadruple to $120 billion by 2030. Sales are growing fast across all major regions, with over 130 million e-bikes sold worldwide between 2020 and 2023.
Asia leads the market with 57% of global revenue, while Europe is the fastest-growing region with a 13.4% annual growth rate. In the U.S., sales jumped 240% from 2019 to 2021, and are expected to hit 6.4 million units per year by 2025.
Key Stats:
1. The global e-bike market is valued at $32 billion in 2025.
2. It’s projected to grow to $51 billion by 2029 and reach $120 billion by 2030 (Allied Market Research, Deloitte).
3. The Asia-Pacific region accounts for 57% of global revenue (Statista).
4. Europe has the fastest growth rate at 13.4% CAGR (Allied Market Research).
5. In the U.S., e-bike sales rose 240% from 2019 to 2021, four times faster than regular bike sales (NPD Group).
6. From 2020 to 2023, over 130 million e-bikes were sold globally (Deloitte).
7. In 2023, China sold over 29 million e-bikes, 60% of the global total (Conebi).
8. Germany sold 2.1 million e-bikes in 2023 (ECF).
9. In the Netherlands, e-bikes made up 50% of all bike sales (ECF).
10. In the U.K., e-bikes accounted for 27% of total bike sales in 2023 (Bike Europe).
11. U.S. sales hit 1.1 million units in 2022 and are expected to reach 6.4 million per year by 2025 (Pew Research).
12. E-bikes now represent 20% of total U.S. bicycle revenue (NPD Group).
Who’s Buying E-Bikes and Why?
More people than ever are choosing e-bikes for commuting, errands, and everyday travel. In the U.S., nearly 1 in 5 cyclists used an e-bike in 2023, up from just 7.8% in 2021.
Most U.S. e-bike owners are aged 45 or older, while in Europe, younger riders are catching on; 31% of those aged 18 to 24 have already tried one.
Convenience is the top reason people buy e-bikes, followed by replacing car trips, climbing hills more easily, and reducing their environmental impact.
Most riders say they enjoy the experience, with 96.4% reporting they prefer e-bikes over traditional bikes, and 75% saying they’d rather ride an e-bike than drive.
Stats:
13. 19.4% of U.S. cyclists used an e-bike in 2023, up from 7.8% in 2021 (TREC).
14. 7% of Americans ride an e-bike at least once a month (TREC).
15. 71% of North American e-bike owners are aged 45 and older (TREC).
16. In Europe, 31% of riders aged 18 to 24 have used an e-bike (TRIP Journal).
17. 62% of U.S. buyers say convenience is a top reason for buying (Consumer Reports).
18. 28% of buyers choose e-bikes to replace car trips (TREC).
19. 59% want help on hilly terrain (TREC).
20. 44% ride e-bikes for environmental reasons (TREC).
21. 48% of German e-bike users commute to work daily (Statista).
22. 53% of female riders in Europe say e-bikes help them feel safer in traffic (T&E Survey).
23. 75% prefer riding an e-bike to driving (TRIP Journal).
24. 96.4% say they enjoy riding e-bikes more than regular bikes (T&F Online).
Read more: Best electric dirt bike for adults in 2025
How Popular Are E-Bikes in Cities?
E-bikes are quickly becoming a preferred mode of transport in cities. More than 50 U.S. cities now include e-bikes in their public bike-share programs, making it easier for people to choose them over cars or traditional bikes.
In New York City, e-bikes make up just 20% of the Citi Bike fleet but are responsible for 35% of total rides. Each e-bike is used an average of 9 times per day, more than double the usage of pedal bikes.
Other cities are seeing similar results: Madison’s ridership doubled after going electric, Copenhagen saw trip distances increase by 40%, and Paris reported a 13% drop in car use after expanding e-bike access.
Stats:
25. More than 50 U.S. cities include e-bikes in their public bike-share fleets (Citi Bike).
26. In NYC, e-bikes make up 20% of the fleet but account for 35% of all rides (Citi Bike).
27. A Citi Bike e-bike is ridden 9 times daily, compared to 3.5 times for a regular bike (Citi Bike).
28. In Madison, Wisconsin, bike-share ridership doubled after switching to e-bikes (BCycle).
29. In Copenhagen, e-bikes increased average trip distance by 40% in the city’s share program (City of Copenhagen).
30. Paris saw a 13% drop in car use after expanding e-bike access (City of Paris).
Do E-Bikes Help the Environment?
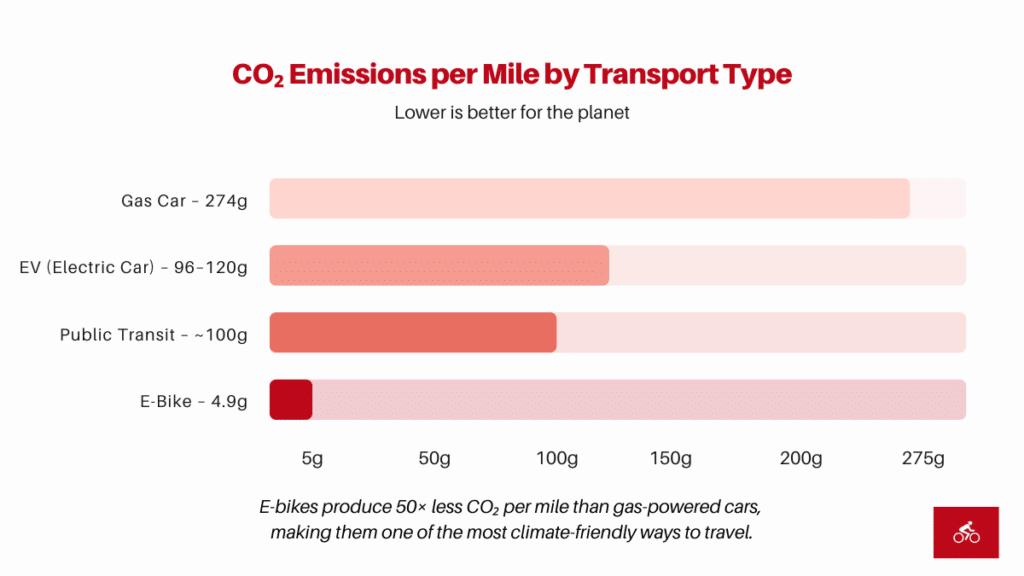
E-bikes are one of the most environmentally friendly ways to get around. They produce just 4.9 grams of CO₂ per mile, compared to 274 grams for a gas-powered car. In fact, e-bikes emit 50 times less CO₂ per mile than cars and are even six times more energy efficient than electric vehicles.
A Portland study found that shifting just 15% of car trips to e-bikes could reduce city emissions by 900 metric tons of CO₂ each day. In Denver, the city’s rebate program alone helps prevent 3,300 metric tons of CO₂ annually.
On a larger scale, if cities across the EU replaced just 10% of urban car miles, it could eliminate 24 million tons of CO₂ each year. With lower lifecycle emissions and far less energy use, e-bikes are a clear win for reducing carbon pollution.
Stats:
31. E-bikes emit only 4.9 g CO₂ per mile, compared to 274 g for a gas car (McQueen et al.).
32. A Portland study found that if 15% of car trips shifted to e-bikes, the city could cut 900 metric tons of CO₂ daily (McQueen et al.).
33. Denver’s rebate program prevents 3,300 metric tons of CO₂ annually (City of Denver).
34. E-bikes emit 50× less CO₂ per mile than gas cars (Efficiency Vermont).
35. Lifecycle emissions: 13 g CO₂/km for an e-bike, 60–75 g/km for an EV (Efficiency Vermont).
36. Replacing 10% of urban car miles with e-bikes could save 24 million tons of CO₂ annually in the EU (Transport & Environment).
37. E-bikes use 18× less energy per mile than small gasoline cars (ITDP).
38. Compared to EVs, e-bikes are 6× more energy efficient per kilometer (Efficiency Vermont).
Are E-Bikes Safe?
E-bike injuries are on the rise, with a 21% increase in the U.S. from 2021 to 2022. Younger riders are especially at risk; 36% of accidents involve people under age 15.
Still, most adult users say they feel safer on e-bikes, thanks to better speed control and motor assist. In fact, 78.3% of e-bike riders report feeling safe in traffic, compared to 63.7% of pedal cyclists.
Battery safety is another concern. New York City recorded 104 battery-related fires in 2021, and many incidents are linked to improper charging or low-quality parts. As e-bike use grows, safety education and proper maintenance will play a bigger role.
Stats:
39. E-bike injuries in the U.S. rose 21% from 2021 to 2022 (CPSC).
40. 36% of e-bike accidents involve riders under age 15 (CPSC).
41. E-bike and e-scooter injuries rose 70% between 2017 and 2021 (CPSC).
42. 35.7% of riders report frequent conflict with cars (TREC).
43. 78.3% of e-bike riders feel safe in traffic, compared to 63.7% of pedal bike riders (Langford et al.).
44. Average road speed: 13.3 km/h for e-bikes, 10.4 km/h for pedal bikes (BioMed Central).
45. Hospitalization rates are higher for e-bike injuries than pedal bike injuries (Langford et al.).
46. 40% of e-bike accidents happen on sidewalks, often involving pedestrians (CPSC).
47. NYC recorded 104 battery-related fires in 2021 (FDNY).
48. China recorded over 10,000 e-bike battery fires between 2013 and 2017 (Chinese Govt).
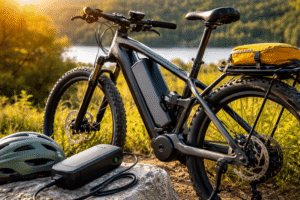
What Technology Powers E-Bikes?
Most e-bikes today run on lithium-ion batteries, which are lighter, longer-lasting, and easier to recharge than older battery types. About 85% of models use them, and most last between 500 to 1,000 charge cycles. Charging typically takes 3 to 6 hours, and many riders now prefer removable batteries for convenience.
Smart features are also on the rise. In 2023, 40% of e-bikes came with built-in GPS, Bluetooth, or smart locks. Performance is improving too, with top-tier motors delivering up to 85 Nm of torque for better hill climbing. Prices are becoming more accessible as well, with the average cost dropping by 10% in 2022.
Stats:
49. 85% of e-bikes use lithium-ion batteries; only 10% use lead-acid (Mordor).
50. Battery lifespan is typically 500 to 1,000 full charge cycles (Battery University).
51. 60% of new buyers want removable batteries for easier charging (Bike Europe).
52. 40% of 2023 models include GPS, Bluetooth, or smart locks (Conebi).
53. E-bike batteries take about 3 to 6 hours to charge fully (Bosch eBike Systems).
54. High-end motors now offer up to 85 Nm of torque, making hill climbing easier (Bosch, Shimano).
55. Average price in 2022: $1,825, down 10% from 2021 (NPD Group).
56. UPS is testing electric trikes for last-mile deliveries (UPS).
57. U.S. Bicycle Commuter Benefit gives tax-free perks to employees using e-bikes (US DOI).
Read more: Common e-bike problems and fixes
How Efficient Are E-Bikes?
E-bikes are extremely efficient, using far less energy than cars and even less than traditional bikes when you factor in distance and speed. Most models can go 25 to 60 miles on a single charge, and use only 0.94 to 1.9 kWh per 100 miles. That means an e-bike can travel over 1,000 miles on the energy in just one gallon of gasoline.
They are also faster. E-bike trips are 21% quicker than pedal bike trips, with speeds reaching up to 28 mph. Plus, riders still get exercise, burning 300 to 400 calories per hour even with pedal assist.
Stats:
58. E-bike trips are 21% faster than pedal bike trips (BioMed Central).
59. Average speed: 15 mph on pedal bikes, up to 28 mph on e-bikes.
60. A typical e-bike drivetrain has 80.28% efficiency (Zhang & Tak).
61. Most e-bikes provide 25 to 60 miles of pedal assistance on one charge.
62. Energy use: 0.94 to 1.9 kWh per 100 miles (Efficiency Vermont).
63. An e-bike can travel 1,000+ miles on the energy in one gallon of gasoline (U.S. DOE).
64. Riders burn 300 to 400 calories per hour while using pedal assist (Harvard Health).
What’s Ahead for E-Bikes?
The future of e-bikes looks promising, with major growth and new technologies on the horizon. By 2030, global sales could top 80 million units annually, and the market is expected to reach $120 billion in value. In Europe alone, 55% of all new bike sales may be electric by then.
Innovations like hydrogen-powered e-bikes and AI-based route planning for delivery fleets are already in development.
More people are also using e-bikes for food delivery and gig work, thanks to low costs and high mobility. Cities are turning to cargo e-bikes as a cleaner alternative to trucks, with global sales hitting $2.1 billion in 2023 and growing steadily.
Stats:
65. Global e-bike sales could exceed 80 million units per year by 2030 (Deloitte).
66. Market value projected at $120 billion by 2030 (Deloitte).
67. In Europe, 55% of all new bike sales by 2030 may be electric (Mordor).
68. Hydrogen-powered e-bikes are being developed for longer commutes (Industry Reports).
69. AI route optimization is being tested for delivery fleets (Logistics News).
70. Cargo e-bike demand continues to rise as cities restrict trucks.
71. Cargo e-bike sales reached $2.1 billion in 2023, with 11.5% annual growth (Conebi).
Surprising E-Bike Facts
E-bikes might feel like a modern invention, but they’ve been around for well over a century. The first U.S. patent for an electric bike dates back to 1895, and Yamaha built a working prototype as early as 1899.
Today, e-bikes are not just trendy, they are practical. Riders save around $1,500 per year on transport costs, and in many cities, they are the fastest way to get around. In bike-share programs, they’re used three times more than pedal bikes. With growing support from governments and delivery companies like UPS, experts agree that e-bikes are here to stay.
Stats:
72. The first U.S. patent for an electric bike was issued in 1895 (USPTO).
73. Yamaha built a working electric bike prototype in 1899 (Yamaha Archives).
74. UPS uses electric trikes for urban delivery (UPS).
75. E-bike riders often travel longer and more frequently than pedal cyclists (TRIP Journal).
76. E-bike commuting saves riders about $1,500 per year in transport costs (Deloitte).
77. In many cities, e-bikes are now the fastest point-to-point mode of transport (Urban Transport Reports).
78. In bike-share programs, e-bikes get 3× more usage than pedal bikes (Citi Bike).
79. E-bikes provide better traffic escape options due to their quick acceleration (TREC).
80. The U.S. government promotes e-bike commuting through tax credits and infrastructure grants (US DOT).
81. Analysts agree that e-bikes are a permanent shift, not a passing trend (Multiple sources).
Sources
- Allied Market Research – Global e-bike market size and growth projections. Available at: AMR
- BioMed Central – Study on e-bike usage and safety risks. Available at: BioMed Central
- Citi Bike NYC – E-bike usage statistics in New York’s bike-sharing program. Available at: Citi Bike NYC
- Conebi – Industry market reports and e-bike market trends. Available at: Conebi
- CPSC (Consumer Product Safety Commission) – E-bike and e-scooter injury statistics. Available at: CPSC
- Deloitte – Global e-bike sales projections and market analysis. Available at: Deloitte
- ECF (European Cyclists’ Federation) – E-bike industry data and reports. Available at: ECF
- Efficiency Vermont – E-bike energy consumption and efficiency analysis. Available at: Efficiency Vermont
- INSG (International Nickel Study Group) – Global e-bike market trends. Available at: INSG
- Langford BC, Chen J, Cherry C (2015) – Study comparing safety behavior of e-bike riders vs. traditional cyclists.
- Madison BCycle – Bike-sharing usage statistics before and after e-bike adoption. Available at: Madison BCycle
- McQueen M, MacArthur J, Cherry C (2019) – The impact of e-bikes on transportation and greenhouse gas emissions.
- Mordor Intelligence – Market research on the global e-bike industry. Available at: Mordor
- NHTSA (National Highway Traffic Safety Administration) – E-bike accident and injury statistics. Available at: NHTSA
- NPD Group – E-bike sales trends and pricing data. Available at: NPD
- Pew Research – Comparative study of e-bike and electric car sales. Available at: Pew Research
- Science Direct – Academic studies on e-bike adoption and transportation trends. Available at: Science Direct
- Transportation Research & Education Center (TREC) – Studies on e-bike commuting and usage trends. Available at: TREC
- Transportation Research Interdisciplinary Perspectives (TRIP) – E-bike safety and environmental impact studies. Available at: TRIP
- U.S. Department of the Interior (DOI) – Bicycle subsidy program and e-bike commuting benefits. Available at: US DOI
Michael Josh is a hands-on e-bike tester and reviewer at BoltBikers, known for putting every model through real-world rides before sharing his thoughts. With a sharp eye for performance, comfort, and build quality, he helps the team choose which bikes are worth featuring. Backed by years of experience in tech and gear reviews, Michael brings trusted, honest insights to help readers find the right e-bike for their needs.